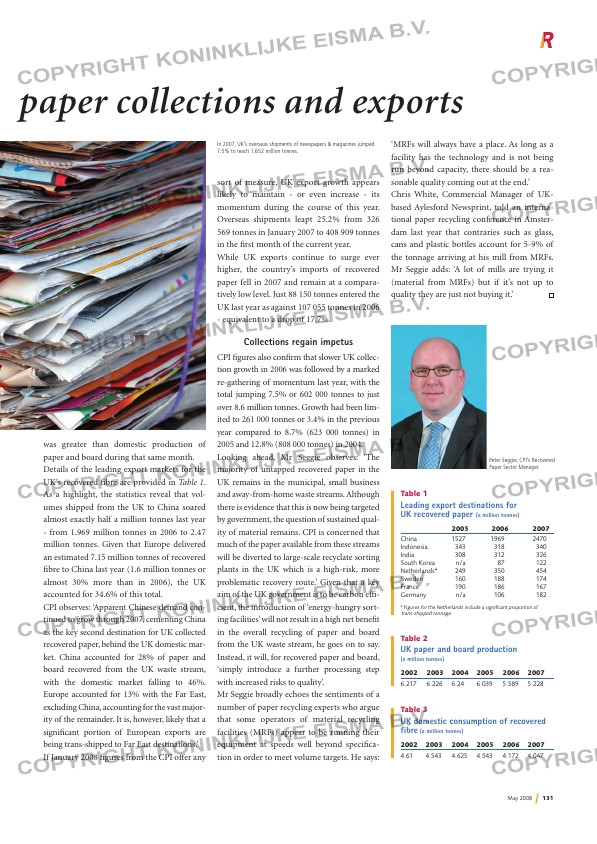
Page 131 from: May 2008

May 2008 131
‘MRFs will always have a place. As long as a
facility has the technology and is not being
run beyond capacity, there should be a rea-
sonable quality coming out at the end.’
Chris White, Commercial Manager of UK-
based Aylesford Newsprint, told an interna-
tional paper recycling conference in Amster-
dam last year that contraries such as glass,
cans and plastic bottles account for 5-9% of
the tonnage arriving at his mill from MRFs.
Mr Seggie adds: ‘A lot of mills are trying it
(material from MRFs) but if it’s not up to
quality they are just not buying it.’
Renewed impetus to UK paper collections and exports
was greater than domestic production of
paper and board during that same month.
Details of the leading export markets for the
UK’s recovered fibre are provided in Table 1.
As a highlight, the statistics reveal that vol-
umes shipped from the UK to China soared
almost exactly half a million tonnes last year
– from 1.969 million tonnes in 2006 to 2.47
million tonnes. Given that Europe delivered
an estimated 7.15 million tonnes of recovered
fibre to China last year (1.6 million tonnes or
almost 30% more than in 2006), the UK
accounted for 34.6% of this total.
CPI observes: ‘Apparent Chinese demand con-
tinued to grow through 2007, cementing China
as the key second destination for UK collected
recovered paper, behind the UK domestic mar-
ket. China accounted for 28% of paper and
board recovered from the UK waste stream,
with the domestic market falling to 46%.
Europe accounted for 13% with the Far East,
excluding China, accounting for the vast major-
ity of the remainder. It is, however, likely that a
significant portion of European exports are
being trans-shipped to Far East destinations.’
If January 2008 figures from the CPI offer any
sort of measure, UK export growth appears
likely to maintain – or even increase – its
momentum during the course of this year.
Overseas shipments leapt 25.2% from 326
569 tonnes in January 2007 to 408 909 tonnes
in the first month of the current year.
While UK exports continue to surge ever
higher, the country’s imports of recovered
paper fell in 2007 and remain at a compara-
tively low level. Just 88 150 tonnes entered the
UK last year as against 107 055 tonnes in 2006
– equivalent to a drop of 17.7%.
Collections regain impetus
CPI figures also confirm that slower UK collec-
tion growth in 2006 was followed by a marked
re-gathering of momentum last year, with the
total jumping 7.5% or 602 000 tonnes to just
over 8.6 million tonnes. Growth had been lim-
ited to 261 000 tonnes or 3.4% in the previous
year compared to 8.7% (623 000 tonnes) in
2005 and 12.8% (808 000 tonnes) in 2004.
Looking ahead, Mr Seggie observes: ‘The
majority of untapped recovered paper in the
UK remains in the municipal, small business
and away-from-home waste streams. Although
there is evidence that this is now being targeted
by government, the question of sustained qual-
ity of material remains. CPI is concerned that
much of the paper available from these streams
will be diverted to large-scale recyclate sorting
plants in the UK which is a high-risk, more
problematic recovery route.’ Given that a key
aim of the UK government is to be carbon effi-
cient, the introduction of ‘energy-hungry sort-
ing facilities’ will not result in a high net benefit
in the overall recycling of paper and board
from the UK waste stream, he goes on to say.
Instead, it will, for recovered paper and board,
‘simply introduce a further processing step
with increased risks to quality’.
Mr Seggie broadly echoes the sentiments of a
number of paper recycling experts who argue
that some operators of material recycling
facilities (MRFs) appear to be running their
equipment at speeds well beyond specifica-
tion in order to meet volume targets. He says:
Table 1
Leading export destinations for
UK recovered paper (x million tonnes)
2005 2006 2007
China 1527 1969 2470
Indonesia 343 318 340
India 308 312 326
South Korea n/a 87 122
Netherlands* 249 350 454
Sweden 160 188 174
France 190 186 167
Germany n/a 106 182
* Figures for the Netherlands include a significant proportion of
trans-shipped tonnage.
Table 2
UK paper and board production
(x million tonnes)
2002 2003 2004 2005 2006 2007
6.217 6.226 6.24 6.039 5.589 5.228
Table 3
UK domestic consumption of recovered
fibre (x million tonnes)
2002 2003 2004 2005 2006 2007
4.61 4.543 4.625 4.543 4.172 4.047
Peter Seggie, CPI’s Recovered
Paper Sector Manager.
In 2007, UK’s overseas shipments of newspapers & magazines jumped
7.5% to reach 1.652 million tonnes.
RI_007_UK Paper exports.indd 3 14-05-2008 13:48:11


