Page 35 from: January / February 2008

America was static at the 2005
level.
However, at 37.2 kg per annum,
Asia’s apparent consumption of
paper and board remains well
below the world average which
increased from 56.3 kg per capita
in 2005 to 58 kg the following year.
In 2006, apparent consumption
reached the following per capita
levels elsewhere in the world:
North America 292 kg; Europe 139
kg; Australasia 119.6 kg; Latin
America 41.6 kg; and Africa 7.1 kg.
Chinese production of paper and
board leapt 16.1% in 2006 to
around 65 million tonnes but is
expected to approach 90 million
tonnes per annum within the next
10 years. ‘This will have a corre-
sponding effect on local recovered
paper collection and imports,’
observes Mr Magnaghi.
Not constructive
The close correlation between collection and
apparent consumption is seen as confirmation of
recent trends towards stocks becoming tighter and
consumers purchasing material on an increasingly
‘just-in-time’ basis, according to Mr Magnaghi. ‘This
behaviour is not constructive because it could create
price instability, not to mention problems of obtain-
ing containers for recovered paper in a timely man-
ner,’ he observes.
As a result of increased demand among the dif-
ferent continents, merchant recovered paper vol-
umes increased to approaching 50 million tonnes in
2006. A breakdown of the world’s leading recovered
paper importers is provided in Table 2.
Turning to other trends, Mr Magnaghi notes that
several Western World mills have recently ceased
production ‘and others will probably follow – possi-
bly because they are too small and insufficiently
modern to be competitive’. There appears to be a
transfer of smaller and medium-sized paper and
board plants to India because of its type of market,
commercial background and private structure. ‘And
there has been an increase in the quantities of
recovered paper available to the Asian market part-
ly because of a drop in mill consumption in certain
Western markets, such as Great Britain,’ he adds.
As to whether collections of sufficiently clean and
cheap material can be increased, Mr Magnaghi
points to the existing high levels of activity in many
countries before concluding: ‘If demand for recov-
ered paper follows current trends, some scarcity
will emerge.’
Constant pressure to collect more
Raising a topic regularly tackled at international
meetings, Mr Magnaghi ponders the reasons why
recovered paper prices have failed to keep pace with
the escalation seen in other secondary raw materi-
als, notably metals. ‘Many operators are wondering
about the reasons for this difference considering the
strength of demand,’ he acknowledges. ‘The answer
is made up possibly of more than one factor: for
instance, constant pressure to collect more and
more recovered paper creates a relative abundance
of materials, and this abundance, by definition, will
reflect on prices. Furthermore, collection of those
last possible available quantities requires more and
more costs in terms of, for example, local trans-
portation, sorting, and baling at a good level of den-
sity.’
The constant upward march of overseas trans-
port costs ‘has had a clear influence on the value of
the materials at the point of destination’, he adds.
‘And it is evident that distant consumers have been
compelled to accept – even if only partially – such
cost increases, probably with repercussions for
their final paper and board product prices.’
Recycling International • January/February 2008 35
P A P E R R E C Y C L I N G
Key recovered paper statistics for 2006 (tonnes)
Apparent
Collection Imports Exports consumption
Asia 70 040 200 28 781 900 5 944 000 92 715 400
Europe 61 716 522 12 370 685 19 669 340 54 417 870
North America 51 819 000 2 407 000 16 926 000 37 300 000
Latin America 8 926 920 1 925 340 293 870 10 558 395
Africa 1 790 425 234 590 70 985 1 954 925
Australasia 1 715 510 7 466 1 170 950 552 026
Totals 196 008 577 45 726 981 44 075 145 197 498 616
Leading recovered paper importers (tonnes)
2005 2006
China 17 030 000 19 620 000
Indonesia 2 520 000 2 811 000
Canada 2 130 000 1 969 000
India 1 475 000 1 760 000
Mexico 1 625 000 1 444 000
South Korea 1 350 000 1 210 000
Thailand 946 000 1 050 000
Taiwan 652 000 761 000
Philippines 380 000 310 000
Table 1
Table 2
* The full version of
Mr Magnaghi’s report can be
viewed on the BIR website at:
www.bir.org
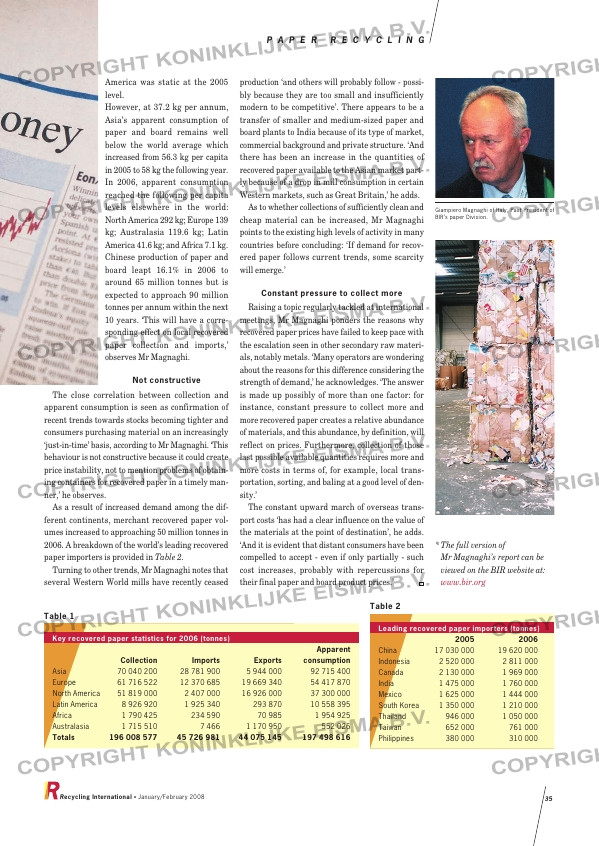
Giampiero Magnaghi of Italy, Past President of
BIR’s paper Division.
RI_045 Magnagi Paper:Opmaak 1 24-01-2008 09:58 Pagina 35


