
Page 30 from: April 2013
30 April 2013
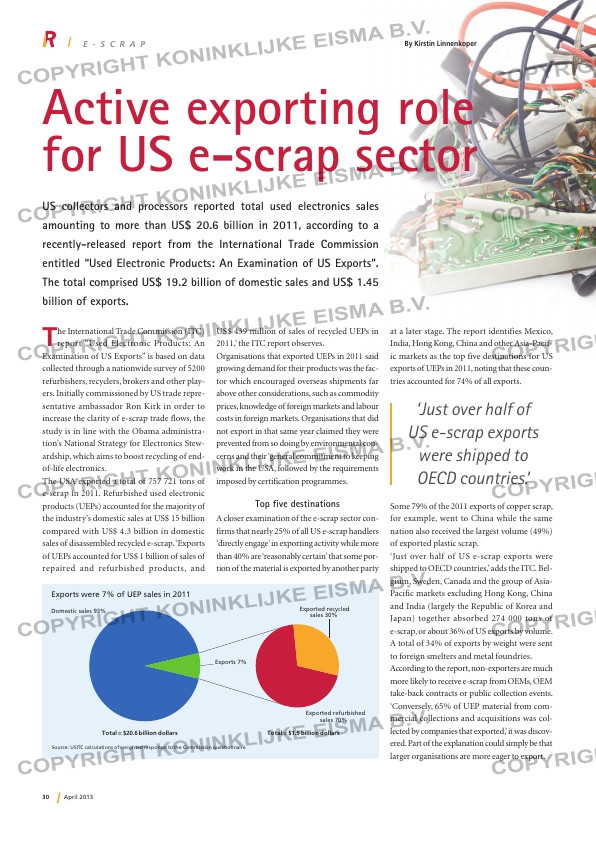
US collectors and processors reported total used electronics sales
amounting to more than US$ 20.6 billion in 2011, according to a
recently-released report from the International Trade Commission
entitled “Used Electronic Products: An Examination of US Exports”.
The total comprised US$ 19.2 billion of domestic sales and US$ 1.45
billion of exports.
E – S C R A P By Kirstin Linnenkoper
The International Trade Commission (ITC) report “Used Electronic Products: An
Examination of US Exports” is based on data
collected through a nationwide survey of 5200
refurbishers, recyclers, brokers and other play-
ers. Initially commissioned by US trade repre-
sentative ambassador Ron Kirk in order to
increase the clarity of e-scrap trade flows, the
study is in line with the Obama administra-
tion’s National Strategy for Electronics Stew-
ardship, which aims to boost recycling of end-
of-life electronics.
The USA exported a total of 757 721 tons of
e-scrap in 2011. Refurbished used electronic
products (UEPs) accounted for the majority of
the industry’s domestic sales at US$ 15 billion
compared with US$ 4.3 billion in domestic
sales of disassembled recycled e-scrap. ‘Exports
of UEPs accounted for US$ 1 billion of sales of
repaired and refurbished products, and
US$ 439 million of sales of recycled UEPs in
2011,’ the ITC report observes.
Organisations that exported UEPs in 2011 said
growing demand for their products was the fac-
tor which encouraged overseas shipments far
above other considerations, such as commodity
prices, knowledge of foreign markets and labour
costs in foreign markets. Organisations that did
not export in that same year claimed they were
prevented from so doing by environmental con-
cerns and their ‘general commitment to keeping
work in the USA, followed by the requirements
imposed by certification programmes.
Top five destinations
A closer examination of the e-scrap sector con-
firms that nearly 25% of all US e-scrap handlers
‘directly engage’ in exporting activity while more
than 40% are ‘reasonably certain’ that some por-
tion of the material is exported by another party
at a later stage. The report identifies Mexico,
India, Hong Kong, China and other Asia-Pacif-
ic markets as the top five destinations for US
exports of UEPs in 2011, noting that these coun-
tries accounted for 74% of all exports.
Some 79% of the 2011 exports of copper scrap,
for example, went to China while the same
nation also received the largest volume (49%)
of exported plastic scrap.
‘Just over half of US e-scrap exports were
shipped to OECD countries,’ adds the ITC. Bel-
gium, Sweden, Canada and the group of Asia-
Pacific markets excluding Hong Kong, China
and India (largely the Republic of Korea and
Japan) together absorbed 274 000 tons of
e-scrap, or about 36% of US exports by volume.
A total of 34% of exports by weight were sent
to foreign smelters and metal foundries.
According to the report, non-exporters are much
more likely to receive e-scrap from OEMs, OEM
take-back contracts or public collection events.
‘Conversely, 65% of UEP material from com-
mercial collections and acquisitions was col-
lected by companies that exported,’ it was discov-
ered. Part of the explanation could simply be that
larger organisations are more eager to export.
‘Just over half of
US e-scrap exports
were shipped to
OECD countries.’
Domestic sales 93%
Exported refurbished
sales 70%
Exported recycled
sales 30%
Exports 7%
Exports were 7% of UEP sales in 2011
Source: USITC calculations of weighted responses to the Commission questionnaire.
Total = $20.6 billion dollars Total = $1.5 billion dollars
Active exporting role
for US e-scrap sector
RI-3_E-Scrap.indd 30 08-04-13 09:16