Page 67 from: March 2008

report explains. ‘Again, the plastics in used wiring
boards act as a reducing agent. Successful trials
were also held in Sweden and Belgium. It is likely
that this will be replicated at other integrated non-
ferrous metal smelting installations.’
US export phenomenon
Across the Atlantic, the PET bottle recycling rate
increased for the third consecutive year in 2006 to
23.5%. This was also the first year in which more of
the PET bottles collected for recycling went to export
markets than stayed in the USA, according to a mar-
ket overview compiled by the National Association
for PET Container Resources (NAPCOR) and The
Association of Postconsumer Plastic Recyclers (APR).
However, the report goes on to suggest that, ulti-
mately, ‘depending on and allowing foreign markets
to harvest the value of a recyclable such as PET bot-
tles does not make good sense’. It continues:
‘Particularly as the issue of sustainability contin-
ues to gain attention and focus, the notion of mov-
ing bottles all over the world based on currency val-
ues will be increasingly hard to justify. Yet, if the
processing capacity does not exist, where are the
bottles to go? The question of why the US reclama-
tion industry has been eroding during the last few
years is perplexing, particularly when these years
have been among the most profitable.’
Collection jumps 9%
In the USA, a total of 5.424 billion pounds of PET
bottles and jars were available for recovery in 2006
(+7% versus 2005) while the amount of post-con-
sumer PET bottles collected for recycling was 1.272
billion pounds – an increase of 9% over 2005. Of this
latter total, US reclaimers purchased 619 million
pounds and export markets 618 million pounds; a
further 35 million pounds was the PET bottle com-
ponent of mixed bale exports, with a significant
fraction going to India. While purchases by domes-
tic reclaimers fell 62 million pounds, the export
total was a massive 170 million pounds higher in
2006. Destinations for this material included
China, Canada, Vietnam and India.
The growth in overall recovered volumes has
been ascribed in part to: a leap of 42 million pounds
in the California collection total; the installation of
an additional 26 automated sorting units through-
out the USA; and additional commercial recovery
efforts.
Domestic purchases were supplemented by
imports totalling 97 million pounds, including 40.5
million from Canada, 36.8 million from Mexico, and
the balance from Central and South America.
Almost 59% of these imports were in the form of
‘dirty flake’, according to NAPCOR. Chinese
exporters’ and domestic companies’ continuing
investments in ‘sort and grind’ facilities resulted in
‘a pronounced increase in the amount of post-con-
sumer bottles purchased by reclaimers and
exporters in the form of dirty flake rather than
bales’, according to the report. ‘A full 19.6% of US
bottles collected eventually found their way to mar-
kets in the form of dirty flake in 2006.’
Lower clean flake capacity
Total capacity among US reclamation plants pro-
ducing clean flake fell around 100 million pounds
to 817 million pounds in 2006. Around 65% of this
capacity was used to produce own-consumption
material for the manufacture of carpet, strapping,
bottles or sheet, while the remainder was made
available to the merchant market.
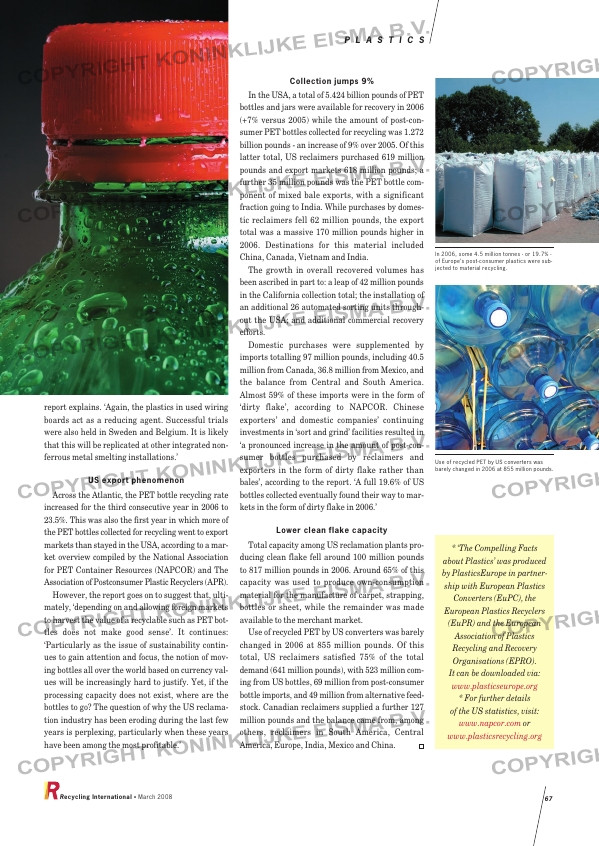
Use of recycled PET by US converters was barely
changed in 2006 at 855 million pounds. Of this
total, US reclaimers satisfied 75% of the total
demand (641 million pounds), with 523 million com-
ing from US bottles, 69 million from post-consumer
bottle imports, and 49 million from alternative feed-
stock. Canadian reclaimers supplied a further 127
million pounds and the balance came from, among
others, reclaimers in South America, Central
America, Europe, India, Mexico and China.
P L A S T I C S
Recycling International • March 2008 67
* ‘The Compelling Facts
about Plastics’ was produced
by PlasticsEurope in partner-
ship with European Plastics
Converters (EuPC), the
European Plastics Recyclers
(EuPR) and the European
Association of Plastics
Recycling and Recovery
Organisations (EPRO).
It can be downloaded via:
www.plasticseurope.org
* For further details
of the US statistics, visit:
www.napcor.com or
www.plasticsrecycling.org
In 2006, some 4.5 million tonnes – or 19.7% –
of Europe’s post-consumer plastics were sub-
jected to material recycling.
Use of recycled PET by US converters was
barely changed in 2006 at 855 million pounds.
RI_005 W Plastic Update 06:Opmaak 1 28-02-2008 11:37 Pagina 67


